1.4 Teaser #1
• Chris Liscio
• Chris Liscio
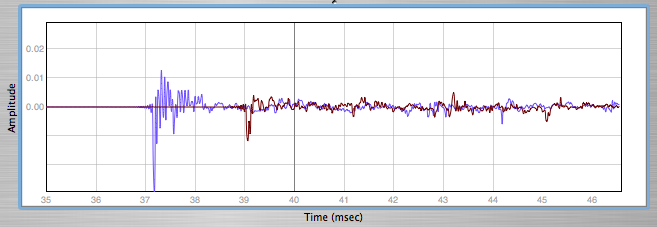
I have done quite a bit of work on the impulse response display, to make way for more time-domain analysis tools. First and foremost, I threw in support for the graph displaying (which gives us milliseconds on the X axis, and amplitude (V/Vmax) on the Y axis. </p> <p> In addition to this, I will add a magnitude display which gives decibels on the Y axis, and milliseconds on the X axis. Using this, you can easily calculate RT-60 by simply eyeing it. Of course, I have some work to do on reducing the "eyeing it" part of the equation, and dump some solid numbers. Soon enough that will come. </p> <p> Also, I now show multiple impulses in the same display. Now you can actually work on time-aligning speakers in a listening environment, or do delay-finding in a live sound environment. To do delay-finding, you would simply measure a loopback, and then the stage to speaker response. With that, you could figure out the delta between the two measurements (again, I plan to help with that), and then get your delay value. Easy peasy, as with everything else in FuzzMeasure. </p> <p> Let the teasing begin: </p> <p>  </p>
</p>